


Crude Oil Prices In 2020: How Unstructured Data Analysis Handled This Exceptional Year…Not Too Badly!
That the global financial and commodity markets were exceptionally volatile during the year gone by, is old news now. The S&P 500 Index corrected more than 35%, only to shoot up by more than 60%. Because of exceptional performances by Tech and new-age companies, which is well documented by now, the NASDAQ Composite had an even better year with the Index almost doubling from its lows. The other markets across regions, barring only a few exceptions, present an almost similar story. To sum it up: the Coronavirus pandemic induced a knee-jerk reaction in the global financial markets. But as with every overcoming the odds story, the silver lining amidst all this chaos is that, not only did the markets recover these losses, in most of the cases, they ended 2020 with a net yearly gain.
Many and in fact, most other assets, currencies and commodities also had a tumultuous and unexpected year. For example, just take a look at Gold. Despite a lukewarm second half because of the popular ‘risk-on’ trade, the year 2020 was a very good year for this commodity. In fact, it was one of the best yearly performance by Gold in the past several decades. What makes it more exceptional is that, this came on the heels of a phenomenal run Gold had in the year 2019. While there has been strong showcasing by many of the financial and physical assets across different markets, when it comes to picking a favourite for the year 2020, our vote goes to, Crude Oil.
The Crude Oil prices have seen the worst in the year 2020 and to their credit, they have also recovered well. We think that the most bizarre price movement that happened, was in Oil Futures. Monday, 20th of April, 2020, will go down in the history books as one of the worst day for the Crude Oil Industry. The May US Oil futures contract on this day went into negative territory for the first time in history. The immediate cause was the Coronavirus pandemic. Because of which the US reserves were full and there was simply no place to put the crude in and everybody was avoiding taking delivery of physical crude. Finally, the numbers were at minus $37.63 a barrel, a decline of $55.90 a barrel during that day after setting a historic low of negative $40.32.
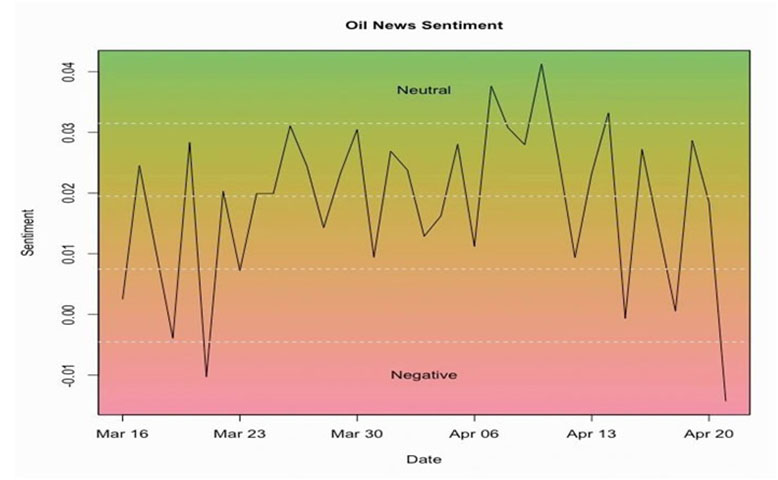
The most interesting part is that while all the fundamental reasons were offered after this event and the historic decline in Crude Oil prices was blamed on 30% decline in the global Crude Oil demand and no consensus on possible production cuts by major exporting countries, the main reason was still the same as it is often observed in exceptional market movements: Negative Sentiment. This was visible on EMAlpha Oil News Sentiment tracker. As seen in this chart, this was at the lowest levels after the impact on sentiment seen during the dip in March because of expected supply glut as a result of price war between Russia and Saudi Arabia.
Figure 1: EMAlpha Oil News Sentiment (March-April 2020)
The second plot (Fig 2) shows the oil price (WTI future) in the blue line and Google Trends Search result for “oil” over the day of April 20th. What is interesting is that Google Trend starts moving sharply before the steep fall in oil.
Fig. 2: Oil (WTI future) in blue and Google Trends Search result for “oil” on April 20th
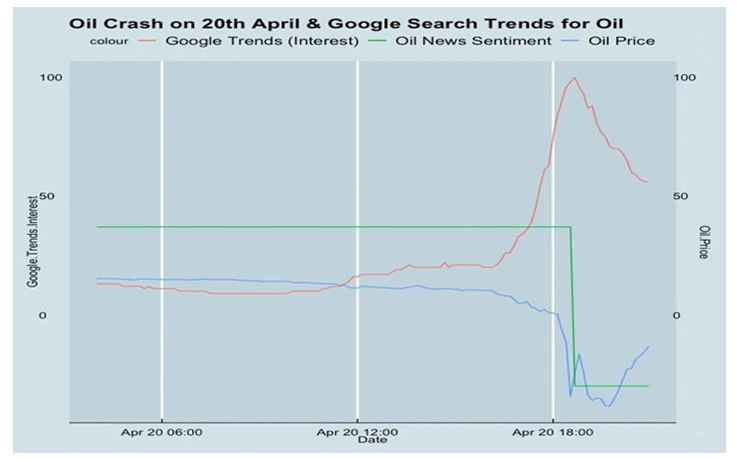
Back then, we didn’t have the hourly sentiment data on Oil for the entirety of April 20th, which we do now. But it is possible that the sentiment might also have sharply fallen before the oil crash. To see if that may have been the case, what we have shown in the plot is a third line which just shows the change in daily Oil sentiment, that goes from positive to negative (see the green line which goes from positive to negative). This is basically the last two data points of the first Oil Sentiment plot. The point is that due to the oil crash, the EMAlpha Daily Oil Sentiment went from positive to negative.
The bottom-line is that we saw a clear collapse in sentiment around the time the price crashed and this was also linked with the sudden spike in searches for ‘Oil’. It is too early to conclusively prove whether the spike in search was an indicator of the crash or whether the price crash led to the sudden surge, what can’t be denied is that this interesting occurrence is too good to just be a coincidence. Essentially, EMAlpha Oil News Sentiment did a more than fair job in predicting price movement and after a few weeks, around Mid-May, all the indications were that, Oil was getting into a more stable territory. To cut a long story short, the EMAlpha Oil News Sentiment started to stabilise and the same kind of sudden dip never occurred again.
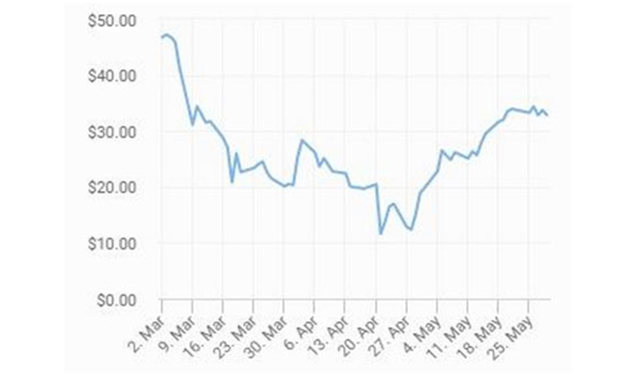
We had written back then that around the middle of May, WTI Crude price was starting to break out from a USD 25 per barrel price range to a higher range(Fig 3). But first, the price was forming a base at that level. For more than ten days, the price was consistently above 30 dollars and it was fairly stable. An upward price movement is always important, but a fairly consistent and narrow range is equally relevant too.
Fig. 3: WTI Crude Price over March-May 2020
The next chart (Fig 4) shows the EMAlpha Oil News Sentiment. While the Sentiment was volatile because it was based on multiple unstructured and varying data points, the Sentiment was clearly showing a significant improvement in the second half of May. As such the average EMAlpha Oil News Sentiment in May was way more positive than either March or April. In the second half of May, the volatility was on the lower side.
Fig. 4: EMAlpha Oil News Sentiment
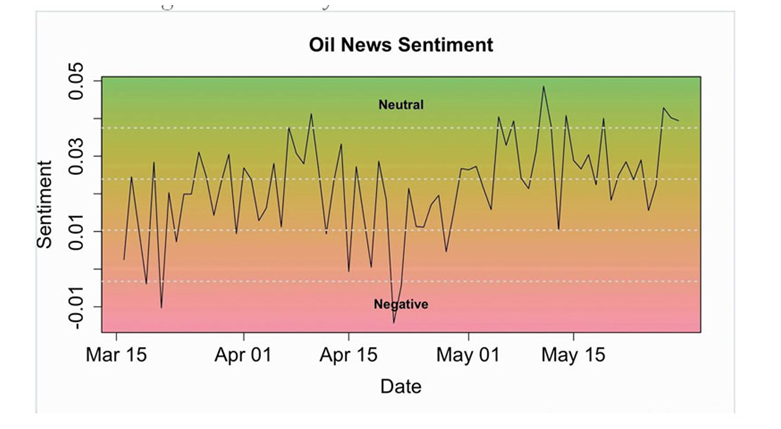
The broader message is that, unstructured data analysis does a good job in making price forecast. We had also highlighted in our insight on May 14, 2020, that the Oil Sentiment was having its ‘Break out’ moment around 10th of May and this change in oil news sentiment indicated that we were past the worst of the Coronavirus crisis and that things would get better from then on. This is exactly how it turned out to be. In the language which is better understood by data enthusiasts, if we were to do a back test for the Oil News Sentiment and Crude Prices, it would be near perfect.
Now, what is the key takeaway from this? We will see a major positive change over the next decade in the case of markets where the biggest hurdle over the past several decades has been a lack of relevant information and access to useful data in a time and cost-effective manner. Many of these challenges are being tackled with reasonable success as more advanced technology becomes available alongside taking the help of NLP tools and new Machine Learning methods. This is going to be a big game changer in the coming years and this will be a powerful driving force for the better integration of information and investment decision making process.
Research Team
EM Alpha LLC
For more EMAlpha Insights on Emerging Markets, please visit https://emalpha.com/insights/. To know how you can use EMAlpha’s unstructured data and ESG (Environmental, Social and Governance) solutions for better investment decisions, please send us an email at [email protected].
About EMAlpha:
EMAlpha, a data analytics and investment management firm focused on making Emerging Markets (EMs) more accessible to global investors and unlocking EM investing using machines. EMAlpha’s focus is on Unstructured Data as the EMs are particularly susceptible to swings in news flow driven investor sentiment. EMAlpha works on information discovery and ESG solutions for Investors in Emerging Markets, using AI and NLP tech. Our mission is: “To help increase capital flow, in terms of FDI and FPI, to Emerging Markets by lowering information barriers using AI/NLP”. EMAlpha Products help achieve both alpha and ESG solutions and the idea is to help asset allocators, asset managers, banks and hedge funds along with companies with cost and time efficient access to relevant information. We use thoroughly researched machine learning tools to track evolving sentiment specifically towards EMs and EMAlpha pays special attention to the timely measurement of news sentiment for investors as these markets can be finicky and sentiment can be capricious. Our team members have deep expertise in research and trading in multiple Emerging Markets and EMAlpha’s collaborative approach to combining machine learning tools with a fundamental approach help us understand these markets better.
Disclaimer:
This insight article is provided for informational purposes only. The information included in this article should not be used as the sole basis for making a decision as to whether or not to invest in any particular security. In making an investment decision, you must rely on your own examination of the securities and the terms of the offering. You should not construe the contents of these materials as legal, tax, investment or other advice, or a recommendation to purchase or sell any particular security. The information included in this article is based upon information reasonably available to EMAlpha as of the date noted herein. Furthermore, the information included in this site has been obtained from sources that EMAlpha believes to be reliable; however, these sources cannot be guaranteed as to their accuracy or completeness. Information contained in this insight article does not purport to be complete, nor does EMAlpha undertake any duty to update the information set forth herein. No representation, warranty or undertaking, express or implied, is given as to the accuracy or completeness of the information contained herein, by EMAlpha, its members, partners or employees, and no liability is accepted by such persons for the accuracy or completeness of any such information. This article contains certain “forward-looking statements,” which may be identified by the use of such words as “believe,” “expect,” “anticipate,” “should,” “planned,” “estimated,” “potential,” “outlook,” “forecast,” “plan” and other similar terms. Examples of forward-looking statements include, but are not limited to, estimates with respect to financial condition, results of operations, and success or lack of success of certain investment strategy. All are subject to various factors, including, but not limited to, general and local economic conditions, changing levels of competition within certain industries and markets, changes in interest rates, changes in legislation or regulation, and other economic, competitive, governmental, regulatory and technological factors affecting the operations of the companies identified herein, any or all of which could cause actual results to differ materially from projected results.