


Vietnam: The Leading EM among Frontier Markets
Synopsis: Among the more than thirty-five Emerging Markets (EMs) that EMAlpha currently tracks, Vietnam has been one of the most exciting market over the past twelve months. The first phase of the Coronavirus pandemic in H1 2020 affected Vietnam in almost the same manner as its other Asian peers but the country’s economy has been a winner on a relative basis. While Apple shifting some of its manufacturing from China to Vietnam will always grab disproportionate amount of media attention, the trend was pretty clear even before the pandemic struck. The local economy is benefitting from increased exports and as a result, in 2020, it did much better than its competition and general expectations. The near-term outlook looks even more promising with at least 7-8% GDP growth rate expected in 2021 and that too on a conservative basis and with much less help from the base effect. The optimism is visible in VN 30, the most popular market index at Ho Chi Minh Stock Exchange (HOSE), the primary stock exchange of Vietnam. The analysis of interesting movement in VN 30 Index and the performance of major gainers and major losers over the last twelve months was significantly helped by EMAlpha’s AI based analysis helping draw major inferences. For example, local news flow was tracked for the companies experiencing tailwinds due to their inclusion in the major index during the next revision. This was the clear case for Phat Dat Real Estate because of significant expansion in its market cap in 2020. As such it doesn’t come as a surprise that in the last twelve months, the stock has gone up by 180%. The unstructured data analysis in other geographies can also be used to assess the potential impact on companies. For example, the Commercial vehicles business has been impacted across several geographies because of the Covid-19 pandemic. This was one of the primary reasons why the stock price of Hoang Huy Investment Financial Services corrected greatly and didn’t recover as quickly as many of the other stocks. Also, the participation in stock market investing and trading has greatly increased owing to strong liquidity support from Central Banks. The retail participation also grew markedly resulting in trading volumes going up significantly and Saigon Securities was a clear beneficiary of this.
Why is Vietnam a regular on EMAlpha screens?
Vietnam has been a major success story to have emerged through the tough times of Covid-19 pandemic as the global economy faltered and several countries experienced an economic contraction. Vietnam has not only been the top-performing Asian economy in 2020, but also has been the most consistent as the country’s economy didn’t experience economic shrinkage even on a quarterly basis. The Government estimates indicate that the Vietnamese economy grew 2.9% last year from a year ago, a figure that is significantly better than China’s 2% plus growth during the same period. Independent estimates also confirm the same and the analysis of global institutions such as the International Monetary Fund (IMF) also show that Vietnam has outperformed all its regional peers in the year 2020.
One of the primary drivers of this fine economic performance has been the fact that the country’s handling of the Coronavirus outbreak was much better than most other countries and it meant that the damage was much less. Despite the smaller contribution of the base effect for growth in 2021, the momentum is still very strong. While the IMF’s forecast for expansion in the Vietnamese economy for 2021 is pegged at a respectable 6.7%, this estimate is highly conservative as compared to many other forecasts. Most investment banks forecasts are in the range of 7.0-9.5% yoy growth for 2021. Independent experts are expecting that the manufacturing sector will continue to provide strong support to the economy’s outperformance in the coming years.
Major Beneficiary of Shift in Manufacturing Industry from China
There are agencies like Fitch talking about how Vietnam has been a major beneficiary of the supply chain relocation and the strong diversification trend that has emerged out of China over the past several years. This will only grow stronger and should considerably help the exports out of Vietnam in the short to medium term. The structural support continues to remain available from the Policy makers and Vietnam has also signed new trade agreements with the U.K. and European Union. The Services sector which was a drag for most of 2020 has also started to show signs of improvement. There is a consensus that while Covid-19 has been a difficult challenge for the Vietnamese economy, just like other economies, the recovery has been the best among the countries from its peer group.
Vietnam’s economic growth has largely been aided by its manufacturing sector. While the shift of manufacturing from China to Vietnam may be only partial and sporadic from the perspective of China, yet it is still significant and meaningful for Vietnam. There are high profile examples of companies like Apple looking beyond China for its manufacturing activities. As per a 27th January 2021 report in Nikkei Asia, Apple is moving its production away from China and shifting some of it to plants in Vietnam. The manufacturing plants in Vietnam will be working on iPads and HomePod mini devices. This change that is happening is also visible in many other sectors as well and this began way before the pandemic. For example, in 2019, furniture shipments from China to the U.S. fell 28% to $9.7 billion, from $13.6 billion in 2018. Vietnam picked up some of that business, resulting in a 35% increase in furniture shipments to the U.S.
Vietnam Stock Market in 2020: Similar to Many Other Global Markets yet Different
Ho Chi Minh Stock Exchange (HOSE) is the largest stock exchange in Vietnam with approximately 400 listed entities. However, most of them are very small. Among the constituent market indices that HOSE has, VN 30 is the most popular index and it tracks the total performance of the top 30 large-cap, liquid stocks listed on the stock exchange. The VN30-Index currently accounts for about 80% of the market capitalization and 60% of the total trading value of the entire Vietnam stock market. The inclusion in this index is based on quantitative factors (market capitalization, transaction liquidity, free-float ratio etc.) and qualitative factors (brand name, transparency etc.).
Table 1: The Market Indices at HOSE
| Index | Total Companies | Total Market Cap | Total Listing Volume |
| VN100 | 100 | 3633364 | 71898128 |
| VN30 | 30 | 3083707 | 52584759 |
| VNALL | 272 | 3806396 | 82382707 |
| VNMID | 70 | 549656 | 19313369 |
| VNSI | 20 | 1331343 | 23111616 |
| VNSML | 172 | 173032 | 10484579 |
Note: Unit: Vol: 1,000 shares, Value: 1,000,000,000 (billions) VND
Source: HoChiMinh Stock Exchange (HOSE) https://www.hsx.vn/Modules/Listed/Web/HoseIndexView/?fid=726e15cba4b04cb09ae4aa0b04bffee0
As reflected in the table and charts below regarding the performance of the VN 30 Index, the market suffered a correction in the first quarter of 2020, just like other global financial markets. This was followed by a gradual recovery from April onwards and then the VN 30 Index started doing well.
Table 2: Quarterly Distribution of VN 30 Index Performance
| VN 30 Index Performance | |
| Full Year (21st February 2020 to 19th February 2021) | 35.9% |
| First Quarter (21st February 2020 to 20th May 2020) | -7.5% |
| Second Quarter (21st May 2020 to 20th August 2020) | -2.1% |
| Third Quarter (21st August 2020 to 20th November 2020) | 21.0% |
| Fourth Quarter (21st November 2020 to 19th February 2021) | 24.2% |
Source: HoChiMinh Stock Exchange (HOSE) and www.investing.com
There are, however, two important features worth highlighting: a) the decline was much less as compared to most other markets as Vietnam did a much better job in containing the Coronavirus pandemic and hence, the economic damage was much less pronounced, b) the performance in the second half of the calendar year 2020 was much more impressive as against the major market indices from the peer group. This was because it started becoming clearer that Vietnam was among the economies which was gaining on a relative basis among the regional peers and also as exporters, as the devastating effects of the pandemic started to wither.
Chart 1: VN 30 Index over last twelve months
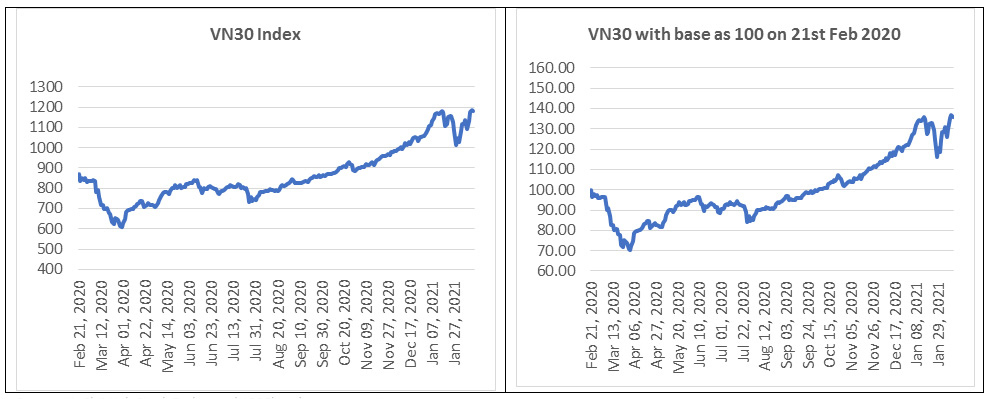
Source: HoChiMinh Stock Exchange (HOSE) and www.investing.com
The VN 30 Index is up by more than 35% in one year and as expected, the constituents are mostly in the range of 10%-50% gains, with as many as 12 contributors or 40% of the total. There are also interesting trends to note: a) the distribution is exceptionally crowded in the 0-10% range with 6 stocks contributing, b) the 50-80% range also has contribution from 6 stocks. Well, nothing unusual so far. But following are some of the things to notice:
- Only 10% of the total or 3 stocks have given negative returns during this period and the worst performer is down by almost 50%. There is also a huge gap between the two worst faring stocks.
- When it comes to the best performer, the same stuff almost gets repeated. There are three stocks in the 70-90% range (it is actually the 75-85% range). But the best performer is up by 181% and has a big lead over the second best. In fact, the gap is much larger than what is seen at the opposite end.
Table 2: Quarterly Distribution of VN 30 Index Performance
| Name | 1 Week | 1 Month | YTD | 1 Year | |
1 |
9.39% |
-10.04% |
16.79% |
-47.82% |
|
2 |
8.09% |
-2.54% |
-7.93% |
-10.91% |
|
3 |
2.64% |
3.81% |
0.74% |
-0.82% |
|
4 |
2.17% |
-1.49% |
5.44% |
2.49% |
|
5 |
3.95% |
3.45% |
7.28% |
3.70% |
|
6 |
4.34% |
-4.19% |
9.07% |
3.86% |
|
7 |
9.35% |
2.66% |
2.66% |
4.10% |
|
8 |
2.67% |
-4.95% |
-6.82% |
5.13% |
|
9 |
6.04% |
3.50% |
2.93% |
6.44% |
|
10 |
9.35% |
-6.50% |
9.87% |
12.38% |
|
11 |
4.22% |
-1.65% |
3.47% |
13.82% |
|
12 |
6.51% |
3.83% |
15.20% |
19.74% |
|
13 |
5.67% |
-9.06% |
-4.04% |
21.40% |
|
14 |
0.00% |
-0.64% |
-0.74% |
22.61% |
|
15 |
6.25% |
8.18% |
15.73% |
24.41% |
|
16 |
5.45% |
11.23% |
24.92% |
40.97% |
|
17 |
4.52% |
-1.60% |
7.09% |
43.13% |
|
18 |
8.48% |
4.88% |
17.81% |
46.99% |
|
19 |
6.27% |
-0.15% |
15.70% |
47.86% |
|
20 |
6.02% |
-2.11% |
7.58% |
48.44% |
|
21 |
1.65% |
1.65% |
21.67% |
48.70% |
|
22 |
3.17% |
0.00% |
3.36% |
58.89% |
|
23 |
2.68% |
14.50% |
29.61% |
63.66% |
|
24 |
3.03% |
-6.27% |
10.65% |
65.49% |
|
25 |
7.50% |
6.61% |
22.86% |
67.53% |
|
26 |
2.81% |
8.32% |
19.71% |
75.67% |
|
27 |
6.99% |
1.71% |
6.75% |
79.06% |
|
28 |
3.95% |
-0.46% |
4.83% |
84.50% |
|
29 |
4.41% |
-1.78% |
0.15% |
120.37% |
|
30 |
3.34% |
17.15% |
26.02% |
181.52% |
Source: HoChiMinh Stock Exchange (HOSE) and www.investing.com
Among the VN 30 Index constituents, we looked at three exceptional performers in more detail: a) the two best performers (Phat Dat Real Estate Development and Saigon Securities Incorporation) which have gone up by more than 100% in the last twelve months, b) the worst performer (Hoang Huy Investment Financial Services Joint Stock Company).
Phat Dat Real Estate Development Corp
As the pandemic started to unveil, the broader market underwent a correction in February and March of 2020. But the stock stayed steady and didn’t undergo a correction, unlike other index constituent stocks and the VN 30 Index. This outperformance was significant on a relative basis.
Table 4: Quarterly Distribution of Phat Dat Real Estate Stock Price Performance
| Phat Dat Real Estate Stock Price Performance | |
| Full Year (21st February 2020 to 19th February 2021) | 181.5% |
| First Quarter (21st February 2020 to 20th May 2020) | 7.9% |
| Second Quarter (21st May 2020 to 20th August 2020) | 7.4% |
| Third Quarter (21st August 2020 to 20th November 2020) | 57.1% |
| Fourth Quarter (21st November 2020 to 19th February 2021) | 54.7% |
Source: HoChiMinh Stock Exchange (HOSE) and www.investing.com
The sharp increase in stock price of Phat Dat Real Estate Development Corp has two distinct phases.
- August and September 2020 – The stock price went up by more than 60%
- From Mid-November till now – The stock price went up by more than 75%.
Effectively, these two phases have captured all the gains and what it means is that out of the twelve months, this five month period is the most critical.
Chart 2: Phat Dat Real Estate Development Stock Price over last twelve months
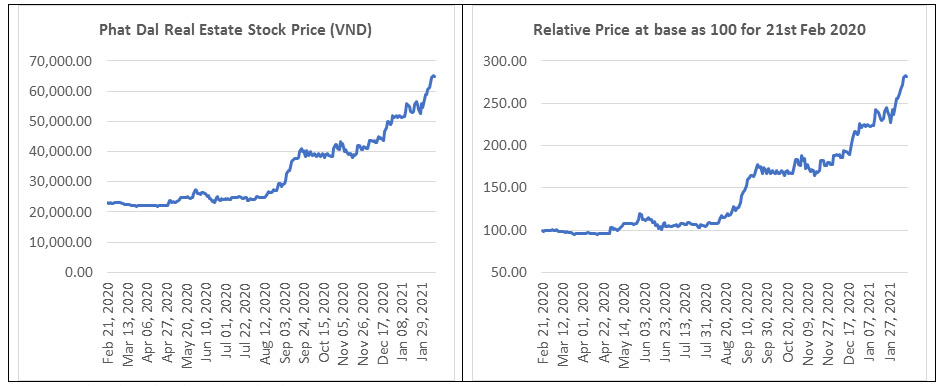
Source: HoChiMinh Stock Exchange (HOSE) and www.investing.com
These two periods coincide with the excellent financial results of the company. But if one were to look closely, the period from November onwards turns out to be more interesting. After the terrific run of the stock and the news that Phat Dat Real Estate was proposed to be included in the MSCI Frontier Market 100 Index, beginning November 2020, the market started anticipating the inclusion of the stock in the VN 30 Index.
- Around mid-November 2020, Phat Dat Real Estate was proposed to MSCI Frontier Market 100 Index.
- In January 2021, Phat Dat Real Estate was included in VN 30 Index.
Chart 3: Phat Dat Real Estate Development Stock Price vs. VN 30 Index over the last twelve months
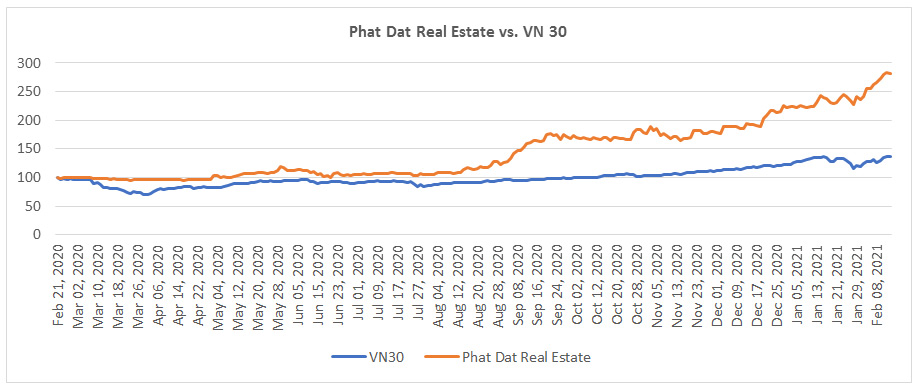
Source: HoChiMinh Stock Exchange (HOSE) and www.investing.com
The following are some of the important news reports on Phat Dat Real Estate Development which are worth highlighting.
- August 2020 – Six Vietnamese firms in Forbes Asia’s Best Under A Billion list (https://e.vnexpress.net/news/business/companies/six-vietnamese-firms-in-forbes-asia-s-best-under-a-billion-list-4148973.html , 19th August 2020)
- November 2020 – Phat Dat realtor proposed to MSCI Frontier Market 100 index (https://e.vnexpress.net/news/business/phat-dat-realtor-proposed-to-msci-frontier-market-100-index-4187766.html , 11th November 2020)
- January 2021 – HoSE releases update of portfolios for indices https://www.vir.com.vn/hose-releases-update-of-portfolios-for-indices-82245.html , 24th January 2021)
- February 2021 – PDR is included in the VN30 index, opening opportunities to access capital flows from domestic and foreign investment funds https://www.phatdat.com.vn/news/pdr-duoc-dua-vao-chi-so-vn30-mo-ra-co-hoi-tiep-can-dong-von-tu-cac-quy-dau-tu-trong-ngoai-nuoc/ (4th February 2021)
It is also important to see that the highest divergence between Phat Dat Real Estate Stock Price and VN 30 Index was between May and August. This was also the time when the markets started to realise that the impact of the Coronavirus pandemic on the company wasn’t going to be as severe as was expected.
Table 5: Correlation coefficient between Phat Dat Real Estate Stock Price and VN 30 Index
| Phat Dat Real Estate Stock Price and VN 30 Index | |
| Full Year (21st February 2020 to 19th February 2021) | 0.932708 |
| First Quarter (21st February 2020 to 20th May 2020) | 0.563564 |
| Second Quarter (21st May 2020 to 20th August 2020) | 0.427367 |
| Third Quarter (21st August 2020 to 20th November 2020) | 0.699400 |
| Fourth Quarter (21st November 2020 to 19th February 2021) | 0.843775 |
Source: EMAlpha
It is important to note that the inclusion in the VN 30 Index wasn’t the only factor that helped the stock because there were two other stocks that were included which didn’t fare as well as Phat Dat Real Estate. Along with the inclusion of Phat Dat Real Estate in the VN30-Index, Bao Viet Holdings (BVH) and Tien Phong Commercial Joint Stock Bank (TPB) were the other two stocks that were also included. These three stocks were included after HoSE eliminated FLC Faros Construction Joint Stock Company (ROS), Saigon Beer Alcohol Beverage Corporation (SAB) and EXIMBANK (EIB).
However, the inclusion of a stock in the index playing as a strong catalyst for its performance doesn’t come as a surprise. There are other such examples. To know more on that, please refer EMAlpha Insight, Sri Lankan Stock Market is on Fire: An Analysis on How the News Flow Is Driving the Blaze? dated 30th January 2021. In January 2021, Sri Lanka was one of the best performing global markets with more than 30% return for the S&P SL20 Index in just under a month and the primary trigger for this was the S&P SL 20 revision. Four out of the top five performers of the index were recent entrants.
Saigon Securities Incorporation
Purely from the stock chart’s perspective, Saigon Securities Incorporation turns out to be even more interesting in comparison to Phat Dat Real Estate. There is almost a perfect mapping between the stock price movement for Saigon Securities Incorporation and the VN 30 Index up until November 2020.
Table 6: Quarterly Distribution of Saigon Securities Incorporation Stock Price Performance
| Saigon Securities Incorporation Stock Price Performance | |
| Full Year (21st February 2020 to 19th February 2021) | 120.4% |
| First Quarter (21st February 2020 to 20th May 2020) | -4.9% |
| Second Quarter (21st May 2020 to 20th August 2020) | 0.3% |
| Third Quarter (21st August 2020 to 20th November 2020) | 26.8% |
| Fourth Quarter (21st November 2020 to 19th February 2021) | 82.1% |
Source: HoChiMinh Stock Exchange (HOSE) and www.investing.com
December 2020 and January 2021 have been the months when the stock price has fared exceptionally well. Of course, the stock also fell when the market corrected in the second half of January 2021, but then the recovery has been equally strong since.
Chart 4: Saigon Securities Incorporation Stock Price over last twelve months
December 2020 and January 2021 have been the months when the stock price has fared exceptionally well. Of course, the stock also fell when the market corrected in the second half of January 2021, but then the recovery has been equally strong since.
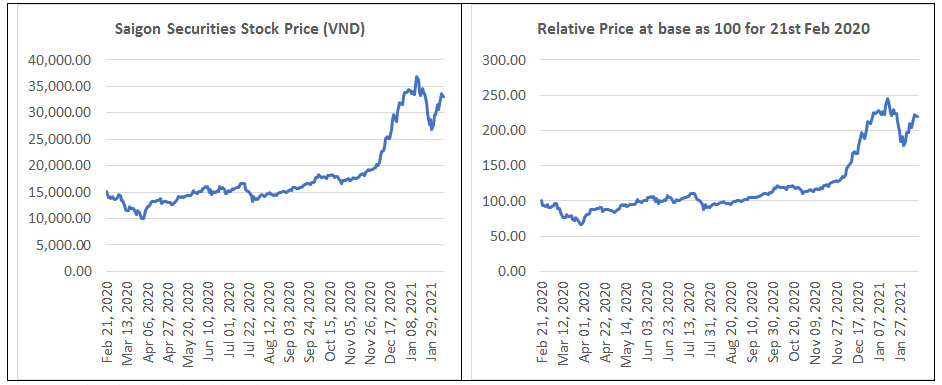
Source: HoChiMinh Stock Exchange (HOSE) and www.investing.com
Chart 5: Saigon Securities Incorporation Stock Price vs. VN 30 Index over last twelve months
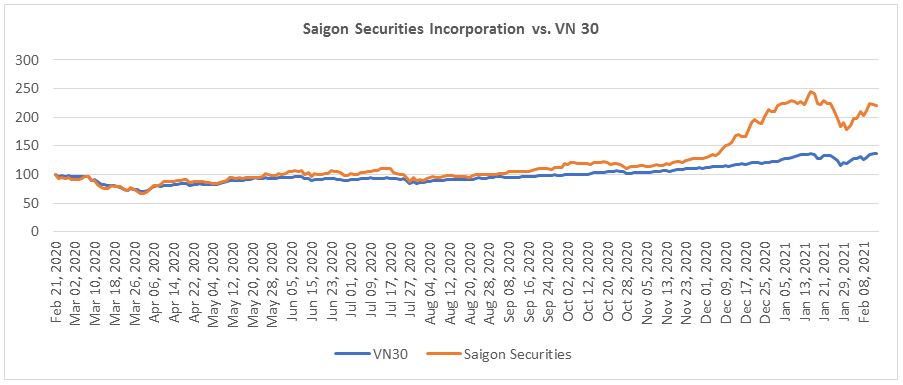
Source: HoChiMinh Stock Exchange (HOSE) and www.investing.com
What drove this sharp movement in stock price for Saigon Securities? In order to answer that, we think that there are some important reports which are worth highlighting. In the case of Saigon Securities, the primary driver has been the substantial increase in trading activity. Low interest rates, a relative stagnation and sluggishness in the real estate market has helped pique the interest levels of investment in stocks. The trading volumes in December 2020 were at historically high levels of VND15 trillion (or more than USD 600 million) while at the same time a year ago, before Covid-19 began affecting the markets, the daily trading volume was just VND4-5 trillion.
The following are some of the major news items regarding Saigon Securities:
- June 2020 – Finance industry crowds Forbes’ Vietnam list of top 50 listed firms, Saigon Securities Incorporation is in the list https://e.vnexpress.net/news/business/companies/finance-industry-crowds-forbes-vietnam-list-of-top-50-listed-firms-4109210.html , 3rd June 2020
- October 2020 – Vietnam’s SSI partners CPJ, DB Group to launch $150m PE Fund https://www.dealstreetasia.com/stories/ssiam-cp-group-dbj-211170/ , 14th October 2020
- December 2020 – VN-Index climbs as securities stocks flourish https://e.vnexpress.net/news/business/economy/vn-index-climbs-as-securities-stocks-flourish-4206410.html, 21st December 2020
- January 2021 – Stock brokerages’ earnings jump as surging markets attract record investor numbers as the stock market rebounded from a Covid-19-induced slump https://e.vnexpress.net/news/business/data-speaks/stock-brokerages-earnings-jump-as-surging-markets-attract-record-investor-numbers-4227173.html, 28th January 2021
It is also important to note that the Saigon Securities Stock Price and VN 30 Index have a very high correlation.
Table 7: Correlation coefficient between Saigon Securities Stock Price and VN 30 Index
| Correlation between Saigon Securities Stock Price and VN 30 Index | |
| Full Year (21st February 2020 to 19th February 2021) | 0.948006 |
| First Quarter (21st February 2020 to 20th May 2020) | 0.882585 |
| Second Quarter (21st May 2020 to 20th August 2020) | 0.768623 |
| Third Quarter (21st August 2020 to 20th November 2020) | 0.864048 |
| Fourth Quarter (21st November 2020 to 19th February 2021) | 0.923931 |
Source: EMAlpha
Hoang Huy Investment Financial Services Joint Stock Company
The picture isn’t as pretty for Hoang Huy Investment Financial Services stock as compared to the other two aforementioned stocks. Almost all the losses came in the first quarter for Hoang Huy Investment Financial Services and the narrative is quite plain and simple: the stock price fell drastically when the market was correcting and then didn’t quite recover when the broader markets were recovering.
Table 8: Quarterly Distribution of Hoang Huy Investment Stock Price Performance
| Hoang Huy Investment Stock Price Performance | |
| Full Year (21st February 2020 to 19th February 2021) | -47.8% |
| First Quarter (21st February 2020 to 20th May 2020) | -50.1% |
| Second Quarter (21st May 2020 to 20th August 2020) | -10.3% |
| Third Quarter (21st August 2020 to 20th November 2020) | 1.5% |
| Fourth Quarter (21st November 2020 to 19th February 2021) | 14.8% |
Source: HoChiMinh Stock Exchange (HOSE) and www.investing.com
After the dramatic fall in the month of February and March of 2020, the small recovery of April couldn’t quite sustain itself and the stock continued to languish and its underperformance in relation to VN 30 Index continued. The stock price remained in a narrow range and the spurt in January 2021 didn’t last long.
Chart 6: Hoang Huy Investment Financial Services Stock Price over the last twelve months
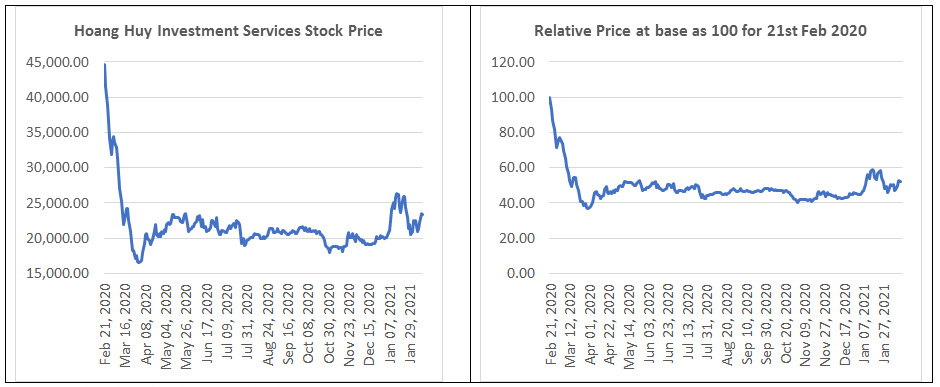
Source: HoChiMinh Stock Exchange (HOSE) and www.investing.com
There was a significant gap between the stock price of Hoang Huy Investment and the VN 30 index in the months of February and March 2020. For about six months, the gap remained at almost the same level. However, it again started to expand from October 2020 onwards.
Chart 7: Hoang Huy Investment Financial Services Stock Price over the last twelve months
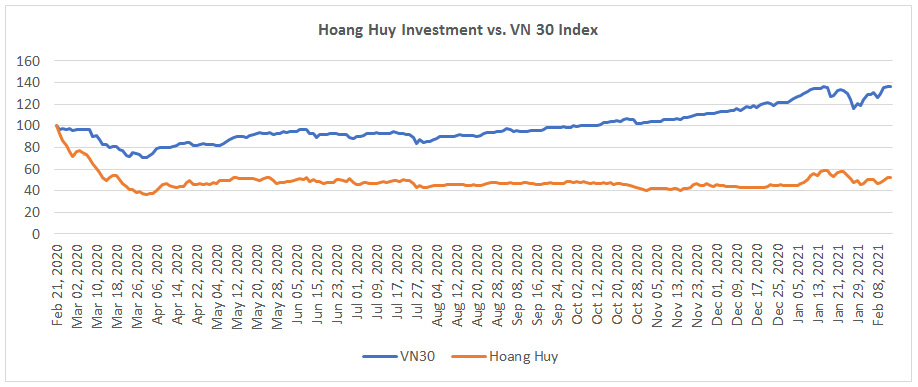
Source: HoChiMinh Stock Exchange (HOSE) and www.investing.com
The primary reason for the fall was that in the three months preceding mid-February 2020 (i.e. from the beginning of November 2019), the stock had done very well, gaining more than 100% within a short span of time. This, when combined with the hit that its core business had taken because of the Coronavirus pandemic impacted the investor sentiment. The severe impact on commercial vehicles business didn’t augur well for the stock price of Hoang Huy Investment Financial Services.
Some of the major news items of Hoang Huy Investment Financial Services are as follows;
- December 2020 – Finance Chairman Hoang Huy wants to buy 5 million TCH shares https://vnexplorer.net/finance-chairman-hoang-huy-wants-to-buy-5-million-tch-shares-a202097893.html , 17th December 2020
- February 2021 – VN-Index moves closer to pre-Tet peak, https://e.vnexpress.net/news/business/economy/vn-index-moves-closer-to-pre-tet-peak-4236403.html , 18th February 2021
There is a very low correlation between Hoang Huy stock price and the VN Index over the last twelve months and this is mostly because of a strong negative relative performance by Hoang Huy during the period between August and November 2020.
Table 9: Correlation coefficient between Hoang Huy Investment Stock Price and VN 30 Index
| Correlation between Hoang Huy Stock Price and VN 30 Index | |
| Full Year (21st February 2020 to 19th February 2021) | 0.092120 |
| First Quarter (21st February 2020 to 20th May 2020) | 0.858458 |
| Second Quarter (21st May 2020 to 20th August 2020) | 0.748475 |
| Third Quarter (21st August 2020 to 20th November 2020) | -0.610436 |
| Fourth Quarter (21st November 2020 to 19th February 2021) | 0.793308 |
Source: EMAlpha
How EMAlpha’s analysis of unstructured data helped in the study of the Vietnam market
EMAlpha’s algorithms were an important tool in identifying the major reasons as to why the broader market (as reflected in the performance of VN 30 Index) was more resilient and the recovery much sharper as compared to its regional peers. Apart from this, there were three major components wherein EMAlpha’s analysis aided in drawing the inferences while analysing the exceptional outperformers and significant underperformers among the constituent stocks of VN 30 Index over last twelve months.
1) The news analysis can be quickly tracked for all companies experiencing tailwinds in order to make an assessment on the chances of their inclusion in the major index during the next revision. They are potentially going to do better when it comes to their stock price performance. This was the clear case for Phat Dat Real Estate, as evident from its stock price performance and significant expansion in the market cap.
2) The automated news flow analysis in other geographies can also be used to assess the potential impact on some of the larger companies in Vietnam. For example, the Commercial vehicles business has been impacted across several geographies because of the Covid-19 pandemic. This was one of the primary reasons why the stock price of Hoang Huy Investment Financial Services corrected hugely and didn’t recover as quickly as many other stocks.
3) Globally, the participation in stock market investing and trading has gone up significantly as a result of strong liquidity support from Central Banks. There has also been an increase in retail participation and all of this meant that trading volumes had to go up significantly. While there are other contributing factors, the above mentioned point makes Saigon Securities Incorporation an interesting case and the stock was a clear beneficiary of this.\
References
- This is Asia’s top-performing economy in the Covid pandemic — it’s not China. Vietnam is likely the top-performing Asian economy in 2020. https://www.cnbc.com/2021/01/28/vietnam-is-asias-top-performing-economy-in-2020-amid-covid-pandemic.html, 28th January 2021
- Vietnam congress to map out path to high-income status by 2045. https://asia.nikkei.com/Politics/Vietnam-congress-to-map-out-path-to-high-income-status-by-2045, 26th January 2021
- Vietnam to grow at 7.8% in 2021. https://e.vnexpress.net/news/business/economy/vietnam-to-grow-at-7-8-pct-in-2021-standard-chartered-4225459.html, 23rd January 2021. Vietnam’s prospects strong in 2021, say analysts https://www.businesstimes.com.sg/asean-business/vietnams-prospects-strong-in-2021-say-analysts, 6th January 2021
- Apple ramps up iPhone and iPad output shift to India and Vietnam, Move is part of wider shift from China that includes Macs, AirPods and more. https://asia.nikkei.com/Economy/Trade-war/Apple-ramps-up-iPhone-and-iPad-output-shift-to-India-and-Vietnam, 27th January 2021
- As production moves out of China, logjams mount in Vietnam and Malaysia, By Thomas Russell, Senior Editor, Furniture Today. https://www.furnituretoday.com/opinion/sourcing-strategies/blog-as-production-moves-out-of-china-logjams-mount-in-vietnam-and-malaysia/ , 12th February 2021
- VN-Index climbs as securities stocks flourish https://e.vnexpress.net/news/business/economy/vn-index-climbs-as-securities-stocks-flourish-4206410.html, 21st December 2020
EMAlpha Products and Services
In most Emerging Markets, information discovery is a major challenge. For example, even if global investors do show interest, how do they solve the problem of timely access to information? The world’s largest capital allocators hold USD 60 trillion and they include GPIF (Japan), GPF (Norway), ADIA (Abu Dhabi), GIC (Singapore) etc. However, only 10% of the capital gets allocated to EMs and ~90% goes to G10. The big hurdle for EMs is: Foreign investors cannot access relevant local information in a timely fashion.
Most market participants and investors from across the world realise that the low rates in G10 makes EM attractive for investors. But, a) Information access is usually a cost and time intensive process for investors, and b) In many EMs, language is a big barrier and because of multiple regional languages, there is a significant delay before news makes it to the mainstream English language. To address these issues, you need solutions like, a) Real time news collection from multiple languages and, b) Instantaneous machine translation and text analytics leading to actionable recommendations for investors.
There are further challenges such as ensuring that companies behave responsibly and that they adopt sustainable business practices. There is a need to ensure that the investors are contributing towards making the world a better place by making investment decisions which reward responsible behaviour of companies. Case in point, ESG (Environmental, Social & Governance) which is increasingly being used as a filter for investment decisions. There are other issues as well such as which data to use and a lack of a standardized framework for evaluation.
Some of these issues are too important to be postponed to a later date and it is in this regard that EMAlpha is making its contribution. EMAlpha has developed a Flexible ESG Framework Management System which is a proprietary technology that makes ESG scores framework agnostic, thus allowing for quick adaptation. In addition, the users decide what matters to them and the EMAlpha system does a classification into E, S, G and more granular categories.
EMAlpha also has solutions for Multilingual data collection and real time targeted information which are based on proprietary processes to collect relevant data across multiple markets. The coverage expands across emerging market equity, currencies and commodities and the work has also been very successful in testing the signals in some key markets for live trading strategies. This is a continuous cycle and a virtuous loop that allows for iterative improvement through AI-human feedback.
With developments in AI and technology in areas like NLP, there are considerable new possibilities to bridge the gap in information between Emerging Markets and the more Developed Markets. This is an area which is turning out to be very exciting because some of the tools mentioned were not available even a couple of years ago. This implies that the evolution in the field will only get faster as time goes on. While the Emerging Markets and the Capital Flow Conundrum is a complex one, there is now much more hope and optimism that with the usage of technology, things will only get better.
At EMAlpha, the ESG team is doing further research on why some issues like Social get more prominence as compared to others like Environmental or Governance issues. To look at specific cases in the context of ESG is a very intense yet interesting exercise and this has been an incredible learning experience for the EMAlpha Research team. The data, information and ratings are a humongous challenge for ESG and it takes time to reach to the depth of the issues as the field is evolving very quickly.
EMAlpha is making a solid contribution in tackling these challenges. EMAlpha has solutions for ESG which are practical, user friendly and although not too simplistic yet easy to use. EMAlpha has developed a Flexible ESG Framework Management System which is a proprietary technology that makes ESG scores framework agnostic, thus allowing for quick adaptation. In addition, the users decide what matters to them and the EMAlpha system does a classification into E, S, G and more granular categories.
We strongly believe that the entire ESG ecosystem requires multiple stakeholders to pull in the right direction in order to make it operational and that will be the most critically determining factor for ESG’s success in making the corporate responsibility actually work. Most importantly, the investors should view ‘E’, ‘S’ and ‘G’ individually and should not confound issues when it comes to the comprehensive ESG evaluation. It is important to understand the right reasons behind ESG investing because this bias could hurt their investment decision making and portfolio performance.
Research Team
EM Alpha LLC
For more EMAlpha Insights on Emerging Markets, please visit https://emalpha.com/insights/. To know how you can use EMAlpha’s unstructured data and ESG (Environmental, Social and Governance) solutions for better investment decisions, please email us at [email protected].
About EMAlpha:
EMAlpha, a data analytics and investment management firm focused on making Emerging Markets (EMs) more accessible to global investors and unlocking EM investing using machines. EMAlpha’s focus is on Unstructured Data as the EMs are particularly susceptible to swings in news flow driven investor sentiment. EMAlpha works on information discovery and ESG solutions for Investors in Emerging Markets, using AI and NLP tech. Our mission is: “To help increase capital flow, in terms of FDI and FPI, to Emerging Markets by lowering information barriers using AI/NLP”. EMAlpha Products help achieve both alpha and ESG solutions and the idea is to help asset allocators, asset managers, banks and hedge funds along with companies with cost and time efficient access to relevant information. We use thoroughly researched machine learning tools to track evolving sentiment specifically towards EMs and EMAlpha pays special attention to the timely measurement of news sentiment for investors as these markets can be finicky and sentiment can be capricious. Our team members have deep expertise in research and trading in multiple Emerging Markets and EMAlpha’s collaborative approach to combining machine learning tools with a fundamental approach help us understand these markets better.
Disclaimer:
This insight article is provided for informational purposes only. The information included in this article should not be used as the sole basis for making a decision as to whether or not to invest in any particular security. In making an investment decision, you must rely on your own examination of the securities and the terms of the offering. You should not construe the contents of these materials as legal, tax, investment or other advice, or a recommendation to purchase or sell any particular security. The information included in this article is based upon information reasonably available to EMAlpha as of the date noted herein. Furthermore, the information included in this site has been obtained from sources that EMAlpha believes to be reliable; however, these sources cannot be guaranteed as to their accuracy or completeness. Information contained in this insight article does not purport to be complete, nor does EMAlpha undertake any duty to update the information set forth herein. No representation, warranty or undertaking, express or implied, is given as to the accuracy or completeness of the information contained herein, by EMAlpha, its members, partners or employees, and no liability is accepted by such persons for the accuracy or completeness of any such information. This article contains certain “forward-looking statements,” which may be identified by the use of such words as “believe,” “expect,” “anticipate,” “should,” “planned,” “estimated,” “potential,” “outlook,” “forecast,” “plan” and other similar terms. Examples of forward-looking statements include, but are not limited to, estimates with respect to financial condition, results of operations, and success or lack of success of certain investment strategy. All are subject to various factors, including, but not limited to, general and local economic conditions, changing levels of competition within certain industries and markets, changes in interest rates, changes in legislation or regulation, and other economic, competitive, governmental, regulatory and technological factors affecting the operations of the companies identified herein, any or all of which could cause actual results to differ materially from projected results.