


After a lacklustre stock price performance for several months after Covid-19 hit the world in Feb-March last year and during which the technology sector witnessed powerful tailwinds, SK hynix had a great run over the last two months of 2020. While the underperformance was pronounced for SK hynix between March and October of last year, the stock outperformed in November and December of 2020. Even though a strong operating performance from the company played its part, the reasons behind the movement were mostly related to macro factors such as a huge trade deal in the region, external validation on growth prospects for the industry and investors’ increasing tilt towards Sustainability and ESG. There are important lessons for institutional investors to gain from what is happening in some of these stocks which behaved in a counter intuitive manner. SK hynix is a prime example that instead of global macro tailwinds which helped the Technology space, the more helpful factors that were instrumental in the stock’s performance were localised in the context of sub-sector or an industry. Some of these themes were captured by EMAlpha’s AI analysis very well. This was the case with SK hynix. A lot of things fell in place for them and the stock price did very well. What can further help in the assessment is the unstructured data analysis in other geographies which can also be used to assess the potential impact on some of the larger companies that belong to a different region. In addition, ESG is a strong driver for improvement in investor perception and we are seeing it in more cases and that too more often and more regularly. But what should be taken into account here is that it is the composition that makes all the difference. As such all the three parameters that make up ESG need to be evaluated separately. The EMAlpha algorithms provide separate scores for E, S and G so that an investor can review the sectoral performance more transparently.
Covid-19 Pandemic: The Impact that Changed the World
It is well documented by now as to how the pandemic induced lockdowns and restrictions adversely impacted the lives and livelihoods of billions of people around the globe. Factories shut down, industries tapered their production, the supply chain was disrupted, men and women lost their jobs and were confined to their houses. They started fearing starvation more than the virus. Things, indeed, changed overnight and that too for the worse.
While Covid-19 turned out to be a bane for many businesses around the globe, there were a few industries that benefited greatly from the same. Tech and Pharma are the two sectors that immediately come to the mind. Apart from these two sectors, there were a few other under-the-radar industries that also saw their businesses rise in the face of the pandemic. For more on that, you can take a look at EMAlpha’s insight, Sri Lankan stock market is on fire: An analysis on how the news flow is driving the blaze?
When Covid-19 hit the world in early 2020, it brought along with it all the uncertainties and panic. The global financial markets took a plunge and the adverse impact was not limited to any particular sector or industry. Tech was no different either. But as the days passed and concepts like ‘work-from-home’ became more common, it became clear that the demand for digital services would increase significantly and this resulted in a rapid global rally for tech stocks, a lift-off that was welcomingly spectacular.
The Curious Case of SK hynix:
SK hynix is a South Korean tech company and one of the global leaders in producing semiconductor, such as DRAM, NAND Flash and CMOS Image Sensors. It is a 90 billion USD market cap company and is the second largest memory chipmaker in the world with Apple, Asus and Dell among its clients. With that kind of resume to boast of, one would assume that after the global plunge in the month of March, SK hynix would have been a major contributor in the tech rally that it witnessed at home and overseas.
Figure 1: SK hynix (One Year Stock Price Performance) – As on 2nd April 2021
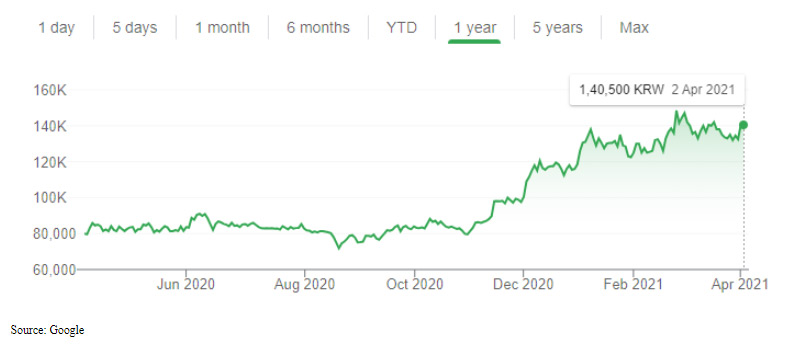
But as can be seen from the above chart, the stock price of SK hynix hardly moved between March 2020 and October 2020.
Table 1: SK hynix Stock Price
| Date | Stock Price (won) |
| April 2, 2020 | 80,000 |
| Oct 30, 2020 | 79,900 |
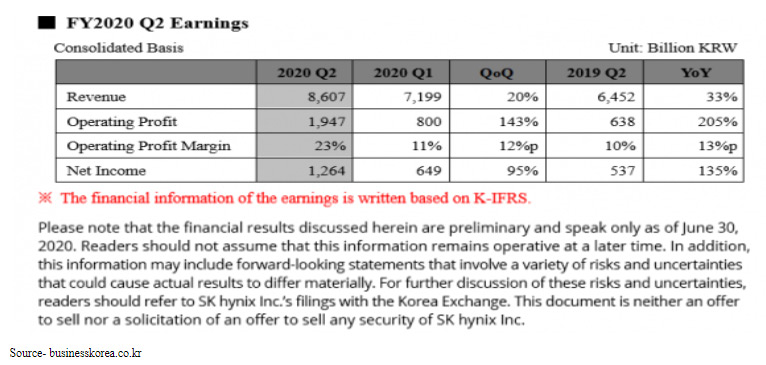
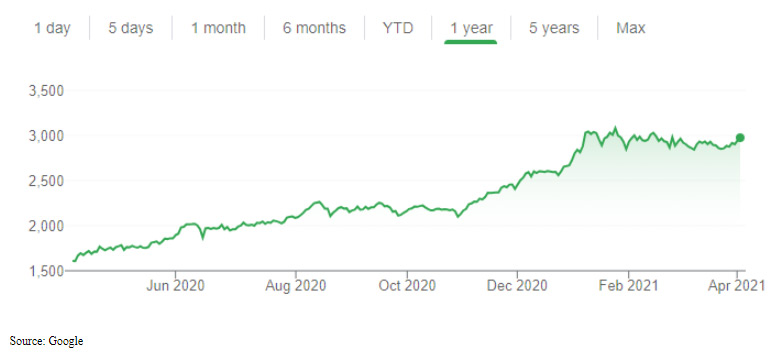
Figure 2: KOSPI 50 (One Year Stock Price Performance) – As on 2nd April 2021
The Calm Before the Storm
All of this changed in November and December. On Nov 03, 2020 the company declared its Q3 results. Its 3 rd quarter results saw net profit and operating profit more than double year-on-year to 1.1 trillion won and 1.3 trillion won respectively. This helped the stock price performance as it gained steam. But the Q3 result wasn’t the only factor that helped the stock. (SK hynix Reports Third Quarter 2020 Results, http://www.businesskorea.co.kr/news/articleView.html?idxno=54382
Table 2: SK hynix – Stock Price Performance in November and December 2020
| Stock Price (Won) | Monthly Stock Price Performance (%) | |
| 30th October 2020 | 79900 | |
| 30th November 2020 | 97500 | 22.0% |
| 31st December 2020 | 118500 | 21.5% |
| Cumulative for Two Months | 48% | |
Source: Google
- SK hynix bought Intel’s NAND business (https://www.investing.com/news/technology-news/intel-nears-deal-to-sell-nand-memory-unit-to-sk-hynix-wsj-2328168). This propelled SK hynix to the second position in global rankings of NAND flash manufacturers.
- In the 3Q FY2020 earnings call, the company CEO narrated the company’s plan to create social value via ESG engagement. SK hynix joined RE 100 to proactively respond to climate change with the aim to secure all of its power consumption to be generated by renewable energy by 2050. (SK hynix and other affiliates to become 100% powered by renewable energy, https://www.kedglobal.com/newsView/ked202011020005)
- On November 15, 2020, fifteen Asia-Pacific nations signed a trade deal, aimed at gradually reducing tariffs across many areas. The Regional Comprehensive Economic Partnership (RCEP), as it is called, thus became the world’s largest trade bloc. On declaration of this deal, SK hynix stock rocketed past 9% to 98,000 won on 16th Nov, 2020. (Asia markets bounce as countries in the region sign trade deal: autos and tech stocks soar, https://www.cnbc.com/2020/11/16/asia-pacific-markets-apac-trade-deal-rcep-oil-and-currencies.html)
- With an increase in demand prospect and an optimistic 2021 earnings outlook, backed by a report from the World Semiconductor Trade Statistics (WSTS), a semiconductor market data provider, which stated that “the world semiconductor market was poised to grow 8.4% to $469.4 billion in 2021”, the investor interest increased further. (Samsung Elec, SK hynix shares fly on projection of another memory boom in 2021,
What happened afterwards?
The performance in 2021 for SK hynix has been mixed and it is not significantly different when comparing it with the benchmark index, KOSPI 50. Although there is month-on-month variation, but broadly speaking the SK hynix performance is in-line with the benchmark index on a three months basis.Table 2: SK hynix – Stock Price Performance in 2021
| Stock Price (Won) | Monthly Stock Price Performance (%) | ||
| 31st December 2020 | 118500 | ||
| 31st January 2021 | 122500 | 3.4% | |
| 28th February 2021 | 141500 | 15.5% | |
| 31st March 2021 | 132500 | -6.4% | |
| Cumulative for Three Months | 12% | ||
The ESG Factor
Although the contribution of news and major macro developments to the rise in stock price of SK hynix in November and December can’t be denied, what can’t also be ignored is the company’s recent navigation towards ESG and increased sensitivity towards important sustainability issues. That the company joined RE 100 is old news now. At the turn of the New Year, SK hynix also announced a roadmap to achieve newly set social contribution goals by 2030 as part of SK Group’s efforts to improve ESG standards. In his new year address, SK Group chairman Chey Tae Won emphasised that “now was the time for the group’s employees to embrace a new spirit of entrepreneurship that prioritizes working together to solve social issues”. This inclination towards maintaining a good ESG conduct stands in line with the current global standards in the post pandemic world. The prominent news items flagged by EMAlpha’s proprietary algorithm are mentioned below:- SK announces social goals https://www.koreatimes.co.kr/www/tech/2021/02/133_302121.html
- SK hynix announces SV 2030: A long-term vision for social value https://news.skhynix.com/sk-hynix-announces-sv-2030-a-long-term-vision-for-social-value/
What do we learn and how EMAlpha’s proprietary algorithms help?
There are important lessons for institutional investors to gain from what is happening in some of these stocks which behaved in a counter intuitive manner. SK hynix is a prime example that instead of global macro tailwinds, the more helpful factors were sector specific positive news flow, excellent financial and operating performance and a push towards ESG. For instance, some of the themes captured by EMAlpha’s analysis were:- It is possible for the market to go up because of a few stocks. It is not necessary that every stock will participate. At the same time, there will be stocks that tend to correct more even when there is no strong underlying reason for the same. However, when the tide turns as it happened with SK hynix in November and December, that can help in strong outperformance in a short span of time for a stock. EMAlpha AI captures these macro events.
- The news analysis can be tracked for the companies experiencing tailwinds as they are potentially going to do better when it comes to their stock price performance. This was the case with SK hynix when a lot of things fell in place for them and the stock price did very well.
- The unstructured data analysis in other geographies can also be used to assess the potential impact on some of the larger companies across the world even when they belong to a different region. Case in point being SK hynix benefitting from the opportunity that was created because of the Covid-19 pandemic in terms of growth in Technology space.
- ESG is a strong driver for improvement in the investor perception. But it is the composition that makes the big difference and as such all the three parameters that make up ESG need to be evaluated separately. The EMAlpha algorithms provide separate scores for E, S and G so that an investor can review the sectoral performance more transparently.
- A key feature of EMAlpha’s NLP algorithms in ESG space is that the attribution analysis is fairly simple and straight forward. Investors need to be very careful in differentiating between actual improvement and progress which is balanced vs. fake and dishonest attempts like ‘greenwashing’ and disproportionate focus on one particular part in an unbalanced way.
EMAlpha Products and Services
In most Emerging Markets, information discovery is a major challenge. For example, even if global investors do show interest, how do they solve the problem of timely access to information? The world’s largest capital allocators hold USD 60 trillion and they include GPIF (Japan), GPF (Norway), ADIA (Abu Dhabi), GIC (Singapore) etc. However, only 10% of the capital gets allocated to EMs and ~90% goes to G10. The big hurdle for EMs is: Foreign investors cannot access relevant local information in a timely fashion.
Most market participants and investors from across the world realise that the low rates in G10 makes EM attractive for investors. But, a) Information access is usually a cost and time intensive process for investors, and b) In many EMs, language is a big barrier and because of multiple regional languages, there is a significant delay before news makes it to the mainstream English language. To address these issues, you need solutions like, a) Real time news collection from multiple languages and, b) Instantaneous machine translation and text analytics leading to actionable recommendations for investors.
There are further challenges such as ensuring that companies behave responsibly and that they adopt sustainable business practices. There is a need to ensure that the investors are contributing towards making the world a better place by making investment decisions which reward responsible behaviour of companies. Case in point, ESG (Environmental, Social & Governance) which is increasingly being used as a filter for investment decisions. There are other issues as well such as which data to use and a lack of a standardized framework for evaluation.
Some of these issues are too important to be postponed to a later date and it is in this regard that EMAlpha is making its contribution. EMAlpha has developed a Flexible ESG Framework Management System which is a proprietary technology that makes ESG scores framework agnostic, thus allowing for quick adaptation. In addition, the users decide what matters to them and the EMAlpha system does a classification into E, S, G and more granular categories.
EMAlpha also has solutions for Multilingual data collection and real time targeted information which are based on proprietary processes to collect relevant data across multiple markets. The coverage expands across emerging market equity, currencies and commodities and the work has also been very successful in testing the signals in some key markets for live trading strategies. This is a continuous cycle and a virtuous loop that allows for iterative improvement through AI-human feedback.
With developments in AI and technology in areas like NLP, there are considerable new possibilities to bridge the gap in information between Emerging Markets and the more Developed Markets. This is an area which is turning out to be very exciting because some of the tools mentioned were not available even a couple of years ago. This implies that the evolution in the field will only get faster as time goes on. While the Emerging Markets and the Capital Flow Conundrum is a complex one, there is now much more hope and optimism that with the usage of technology, things will only get better.
At EMAlpha, the ESG team is doing further research on why some issues like Social get more prominence as compared to others like Environmental or Governance issues. To look at specific cases in the context of ESG is a very intense yet interesting exercise and this has been an incredible learning experience for the EMAlpha Research team. The data, information and ratings are a humongous challenge for ESG and it takes time to reach to the depth of the issues as the field is evolving very quickly.
EMAlpha is making a solid contribution in tackling these challenges. EMAlpha has solutions for ESG which are practical, user friendly and although not too simplistic yet easy to use. EMAlpha has developed a Flexible ESG Framework Management System which is a proprietary technology that makes ESG scores framework agnostic, thus allowing for quick adaptation. In addition, the users decide what matters to them and the EMAlpha system does a classification into E, S, G and more granular categories.
We strongly believe that the entire ESG ecosystem requires multiple stakeholders to pull in the right direction in order to make it operational and that will be the most critically determining factor for ESG’s success in making the corporate responsibility actually work. Most importantly, the investors should view ‘E’, ‘S’ and ‘G’ individually and should not confound issues when it comes to the comprehensive ESG evaluation. It is important to understand the right reasons behind ESG investing because this bias could hurt their investment decision making and portfolio performance.
Research Team, EMAlpha LLC
For more EMAlpha Insights on Emerging Markets, please visit https://emalpha.com/insights/. To know how you can use EMAlpha’s unstructured data and ESG (Environmental, Social and Governance) solutions for better investment decisions, please email us at [email protected].
About EMAlpha:
EMAlpha, a data analytics and investment management firm focused on making Emerging Markets (EMs) more accessible to global investors and unlocking EM investing using machines. EMAlpha’s focus is on Unstructured Data as the EMs are particularly susceptible to swings in news flow driven investor sentiment. EMAlpha works on information discovery and ESG solutions for Investors in Emerging Markets, using AI and NLP tech. Our mission is: “To help increase capital flow, in terms of FDI and FPI, to Emerging Markets by lowering information barriers using AI/NLP”. EMAlpha Products help achieve both alpha and ESG solutions and the idea is to help asset allocators, asset managers, banks and hedge funds along with companies with cost and time efficient access to relevant information. We use thoroughly researched machine learning tools to track evolving sentiment specifically towards EMs and EMAlpha pays special attention to the timely measurement of news sentiment for investors as these markets can be finicky and sentiment can be capricious. Our team members have deep expertise in research and trading in multiple Emerging Markets and EMAlpha’s collaborative approach to combining machine learning tools with a fundamental approach help us understand these markets better.
Disclaimer:
This insight article is provided for informational purposes only. The information included in this article should not be used as the sole basis for making a decision as to whether or not to invest in any particular security. In making an investment decision, you must rely on your own examination of the securities and the terms of the offering. You should not construe the contents of these materials as legal, tax, investment or other advice, or a recommendation to purchase or sell any particular security. The information included in this article is based upon information reasonably available to EMAlpha as of the date noted herein. Furthermore, the information included in this site has been obtained from sources that EMAlpha believes to be reliable; however, these sources cannot be guaranteed as to their accuracy or completeness. Information contained in this insight article does not purport to be complete, nor does EMAlpha undertake any duty to update the information set forth herein. No representation, warranty or undertaking, express or implied, is given as to the accuracy or completeness of the information contained herein, by EMAlpha, its members, partners or employees, and no liability is accepted by such persons for the accuracy or completeness of any such information. This article contains certain “forward-looking statements,” which may be identified by the use of such words as “believe,” “expect,” “anticipate,” “should,” “planned,” “estimated,” “potential,” “outlook,” “forecast,” “plan” and other similar terms. Examples of forward-looking statements include, but are not limited to, estimates with respect to financial condition, results of operations, and success or lack of success of certain investment strategy. All are subject to various factors, including, but not limited to, general and local economic conditions, changing levels of competition within certain industries and markets, changes in interest rates, changes in legislation or regulation, and other economic, competitive, governmental, regulatory and technological factors affecting the operations of the companies identified herein, any or all of which could cause actual results to differ materially from projected results.