


Facebook-Jio Deal and Stock Price Movement in Reliance Industries Limited Immediately Before that
We wanted to write this immediately after the Facebook-Reliance Jio deal but we wanted the dust to settle first and also see a slightly longer price movement before we can draw meaningful inferences on how stock price of Reliance Industries has reacted. On the morning of 22nd April 2020, Reliance Industries Ltd. (the largest market cap company in India and almost 30% bigger than the nearest competitor) announced a deal with Facebook. Reliance announced that Facebook will Invest ₹ 435.74 bn (or USD 5.6bn) in Jio Platforms for a 9.99% Stake. This was big news as it was also the largest Foreign Direct Investment (FDI) for any minority investment in India, so far. (https://www.bseindia.com/xml-data/corpfiling/AttachHis/06bee64f-7dad-4b4c-b54b-ebc195078f95.pdf)
Naturally, the stock reacted. It has gained more than 20% from the lows of the week and that means more than USD 20 bn increase in value. This is also not the time when the market has done much. But the more interesting part is what happened on 21st April. It was the day when Reliance had touched the bottom of the week. As you can see in the following chart, the stock was under serious pressure during most of the trading session on 21st April, before the Facebook-Jio deal announcement.
Fig. 1 Stock Price Chart for RELIANCE INDUSTRIES (RIL:IN) (Source: BSE India)
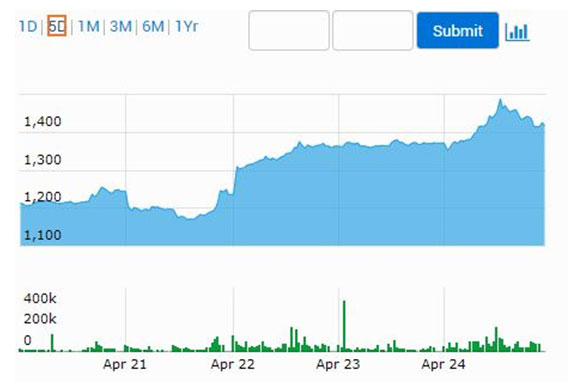
Approximately, the stock price was like this on 21st April (all timings in IST)
1) 9:30 am – Rs 1,200
2) 10:45 am – Rs 1,201
3) 12:30 pm – Rs 1,180
4) 13:10 pm – Rs 1,171
5) 3:00 pm – Rs 1,202
6) 3:30 pm – Rs 1,236
In a matter of couple of hours on 21st April before the close of trading session, the stock gained more than 6%. It was clearly against the trend of the day for the stock. The performance looks even more startling when you see that the market has lost more than 3% that day. So, relative performance would look even better than absolute performance of the Reliance Industries stock.
When you look at the daily stock prices this week, there is no doubt that Facebook deal has been the primary driver.
1) 20th April – Rs 1,244
2) 21st April – Rs 1,236
3) 22nd April – Rs 1,363
4) 23rd April – Rs 1,371
5) 24th April – Rs 1,417
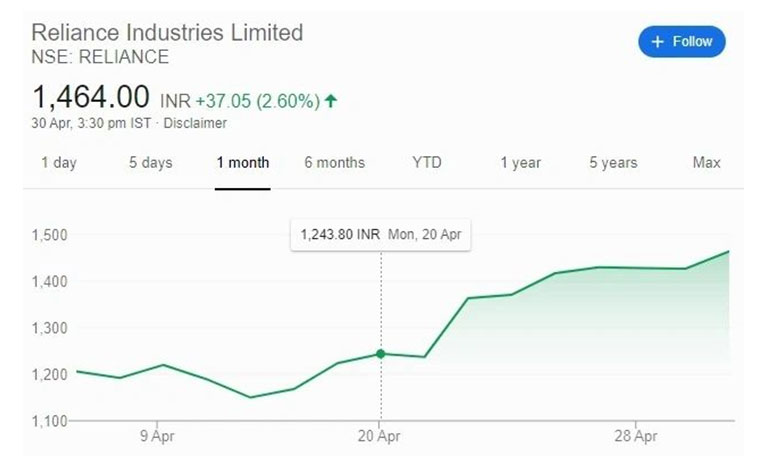
Another interesting thing to note is that after the impressive gains made by Reliance Industries Ltd. stock in the week of 20th April, the previous week (27th April – 30th April as 1st May was a holiday for Stock Exchanges in India) was not that great for the stock. While the broader markets made handsome gains, it underperformed by more than 50%.
Fig. 2: One Month Stock Price Chart for RELIANCE INDUSTRIES (RIL:IN) (Source: Google)
There are several possible inferences depending on how you want to see the price movement on 21st April in Reliance Industries stock, but one thing which we think is most important is the impact of sentiment and news flow on price. We can look at the news flow with sentiment and extrapolate this to price and this can be done other way round as well. At EMAlpha, this is what we focus on exploring and identifying.
Research Team
EM Alpha LLC
For more EMAlphainsights on Emerging Markets, please visit https://emalpha.com/insights/. To know how you can use EMAlpha’s unstructured data on Emerging Markets for better investment decisions, please send us an email at [email protected].
About EMAlpha:
EMAlpha, a data analytics and investment management firm focused on making Emerging Markets (EMs) accessible to global investors and unlocking EM investing using machines. EMAlpha’s focus is on Unstructured Data as the EMs are particularly susceptible to swings in news flow driven investor sentiment. We use thoroughly researched machine learning tools to track evolving sentiment specifically towards EMs and EMAlpha pays special attention to the timely measurement of news sentiment for investors as these markets can be finicky and sentiment can be capricious.Our team members have deep expertise in research and trading in multiple Emerging Markets and EMAlpha’s collaborative approach to combining machine learning tools with a fundamental approach help us understand these markets better.
Disclaimer:
This insight article is provided for informational purposes only. The information included in this article should not be used as the sole basis for making a decision as to whether or not to invest in any particular security. In making an investment decision, you must rely on your own examination of the securities and the terms of the offering. You should not construe the contents of these materials as legal, tax, investment or other advice, or a recommendation to purchase or sell any particular security. The information included in this article is based upon information reasonably available to EMAlpha as of the date noted herein. Furthermore, the information included in this site has been obtained from sources that EMAlpha believes to be reliable; however, these sources cannot be guaranteed as to their accuracy or completeness. Information contained in this insight article does not purport to be complete, nor does EMAlpha undertake any duty to update the information set forth herein. No representation, warranty or undertaking, express or implied, is given as to the accuracy or completeness of the information contained herein, by EMAlpha, its members, partners or employees, and no liability is accepted by such persons for the accuracy or completeness of any such information. This article contains certain “forward-looking statements,” which may be identified by the use of such words as “believe,” “expect,” “anticipate,” “should,” “planned,” “estimated,” “potential,” “outlook,” “forecast,” “plan” and other similar terms. Examples of forward-looking statements include, but are not limited to, estimates with respect to financial condition, results of operations, and success or lack of success of certain investment strategy. All are subject to various factors, including, but not limited to, general and local economic conditions, changing levels of competition within certain industries and markets, changes in interest rates, changes in legislation or regulation, and other economic, competitive, governmental, regulatory and technological factors affecting the operations of the companies identified herein, any or all of which could cause actual results to differ materially from projected results.